

What will BTC's price be by the end of 2025?

For this analysis, I used metrics like the MVRV Z-Score, Energy Value Oscillator, Bitcoin Heater, Macro Index, and other indicators, as well as historical data. Though history is a useful guide, it may be less accurate under current conditions, given that the 2021 cycle lacked players like Strategy, Metaplanet, and the ETFs.
1. MVRV Z-Score (Market Value to Realized Value)
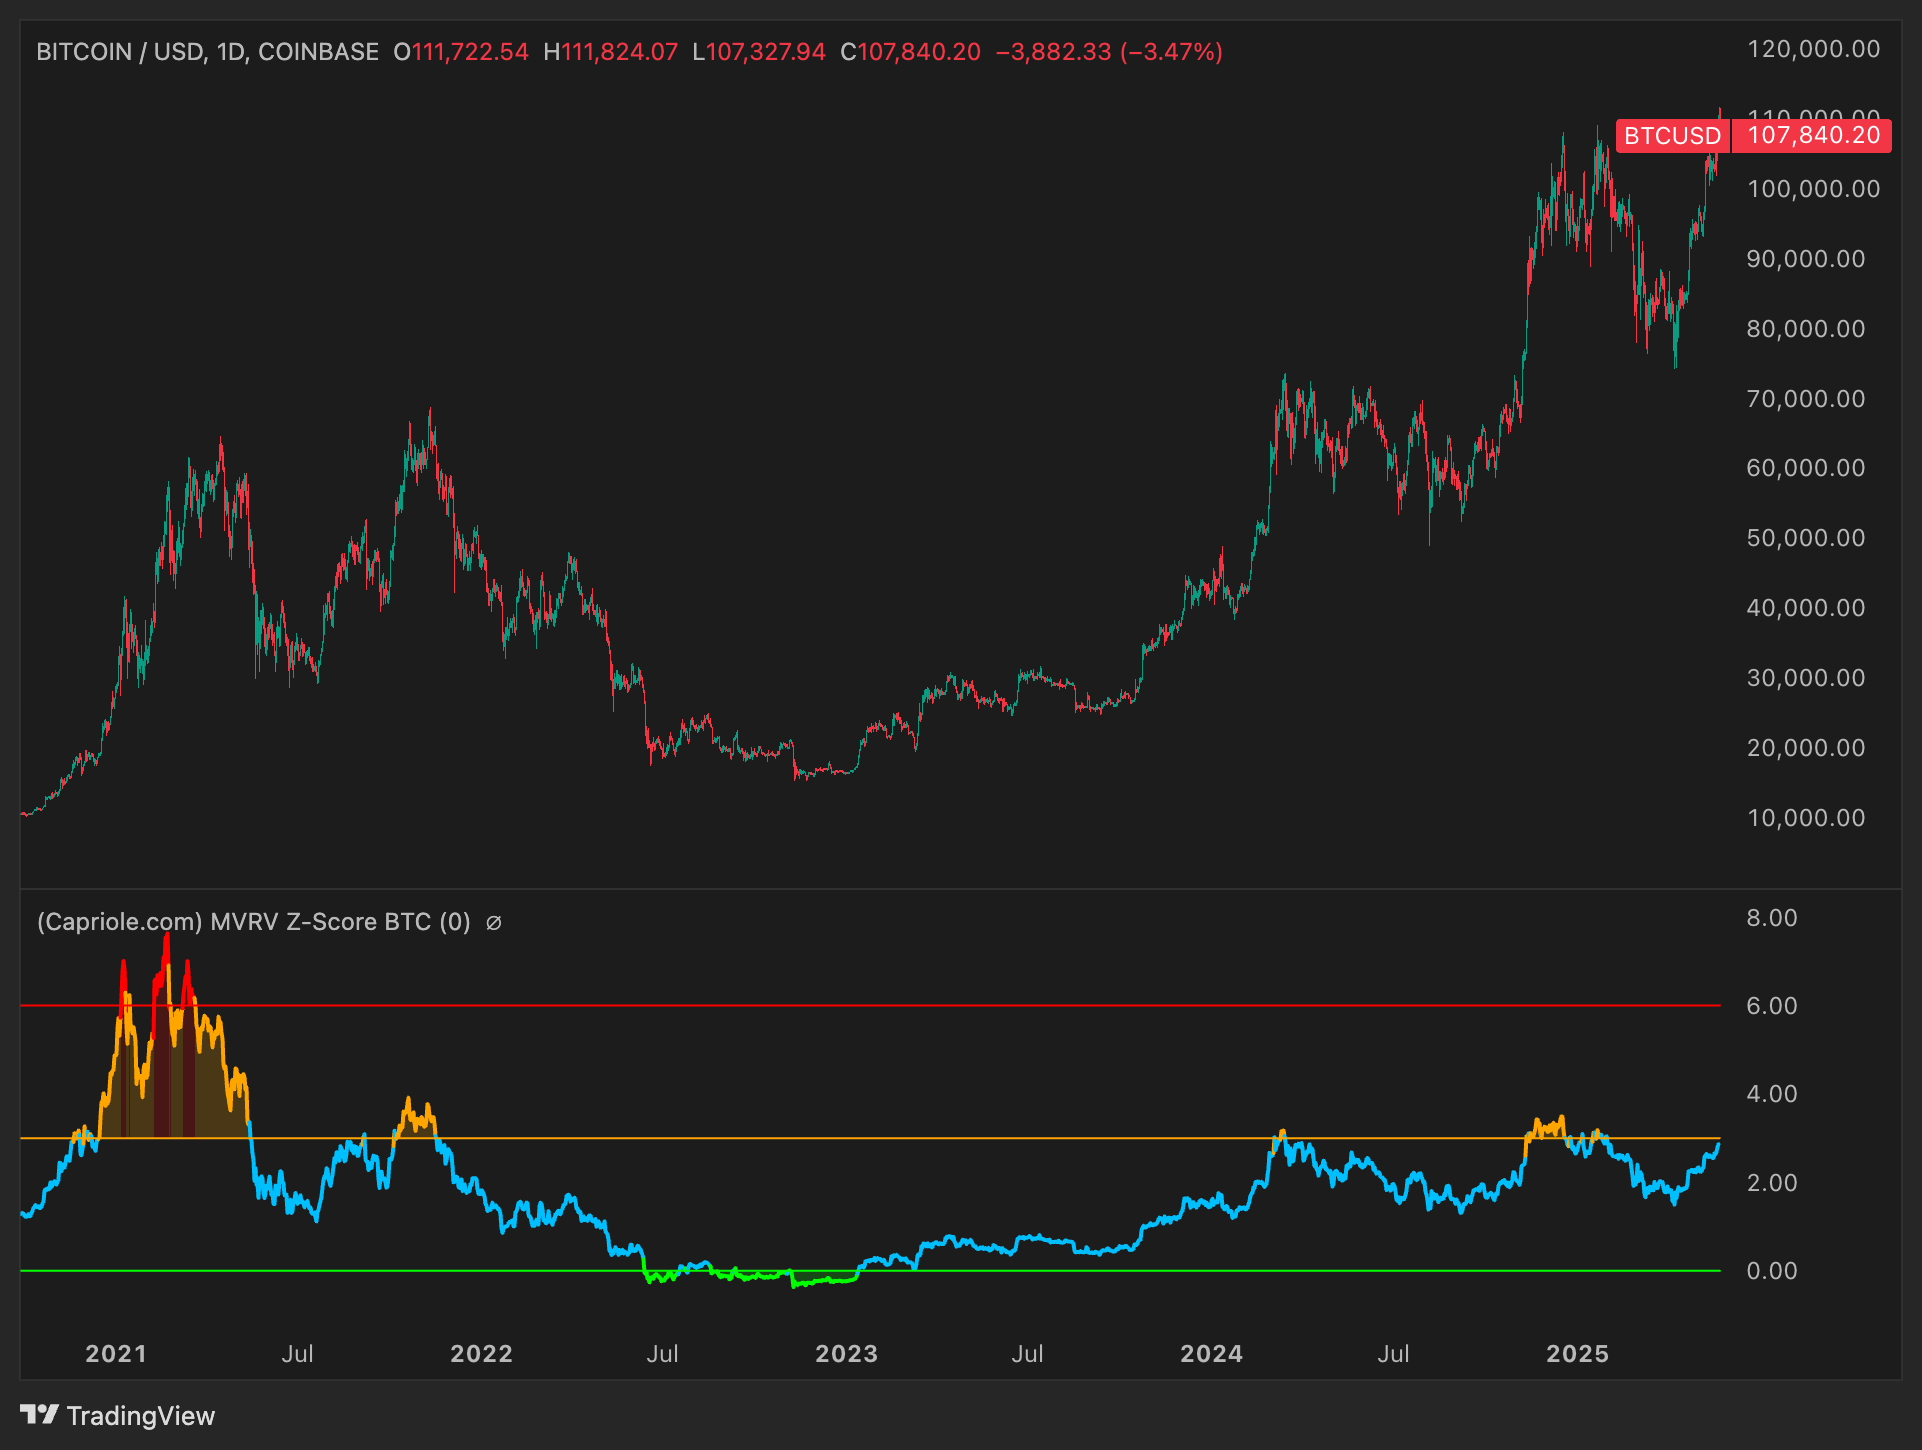
The chart shows the current MVRV Z-Score sits around ~2–3 — a neutral zone, far from the overheated readings seen at market tops. Historically, Bitcoin cycle peaks pushed the score into the red zone (~7–9), signaling extreme dislocation between market cap and realized value. Today, the score is just above 2, which corresponds to a blue/yellow zone — suggesting BTC is not overvalued. For context: in early 2021, before BTC topped around $60–65K, the Z-Score was over 7. During the 2022 bear market, it dropped below 0 (green zone), pointing to oversold conditions.
From a technical standpoint, the current level leaves significant room for further upside before this cycle reaches exhaustion. Even at ~$100K–110K, BTC doesn't look "expensive" by MVRV standards. If BTC were to repeat the structural patterns of previous tops, we'd expect MVRV Z-Score to rise toward 5–7 or higher.
This implies significant upside from here. A basic extrapolation suggests that MVRV-based tops tend to occur when BTC trades well above $100K — potentially in the $200K+ range, depending on how realized cap evolves in the coming months.
2. Energy Value Oscillator
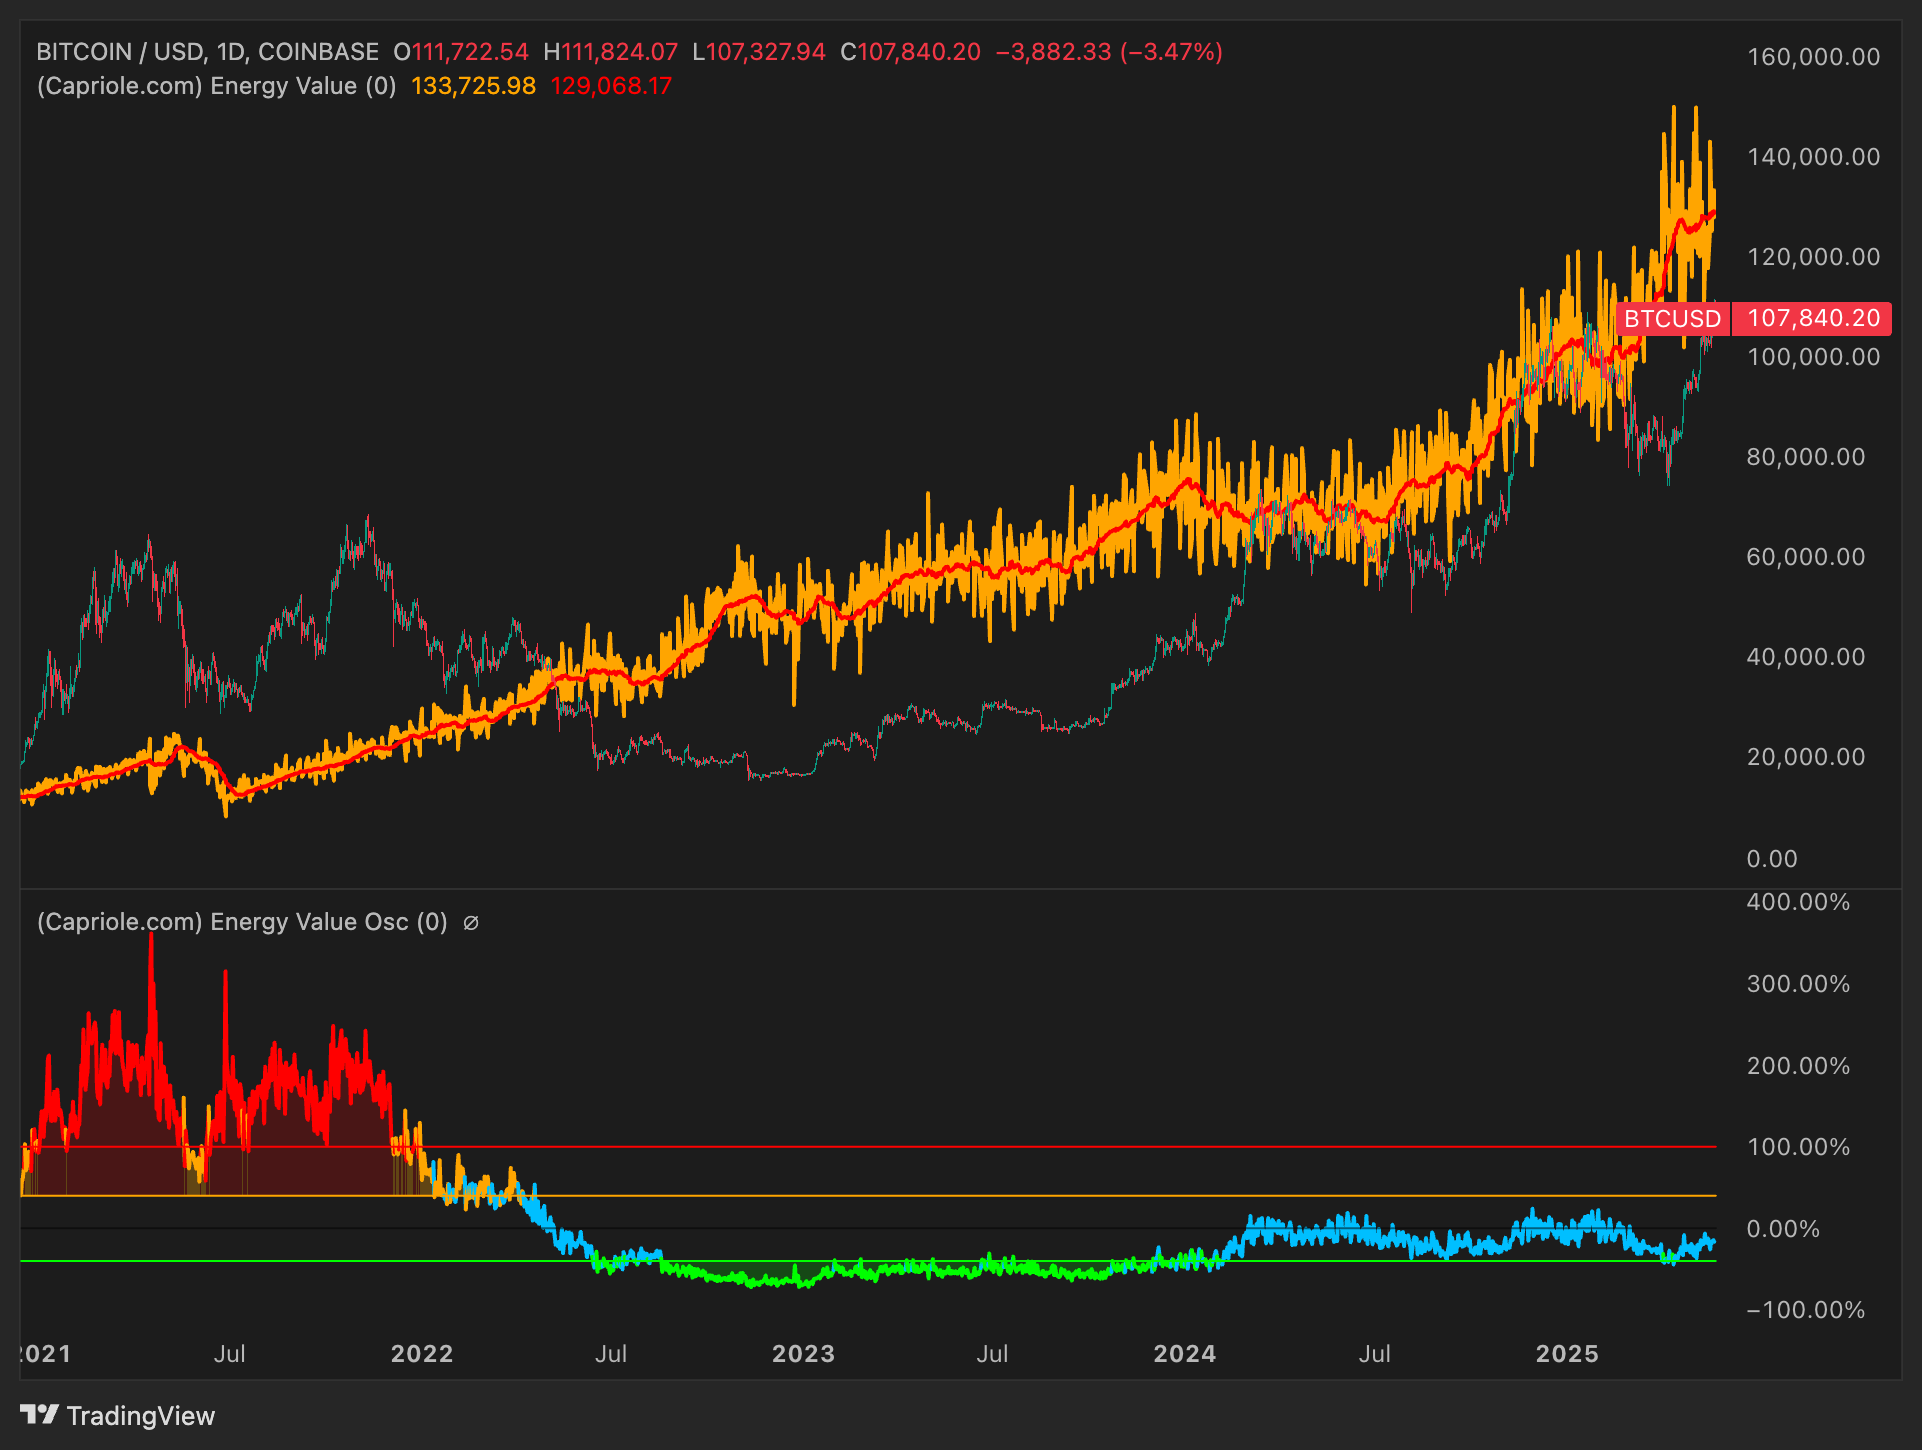
This metric measures Bitcoin’s "fair value" based on aggregate energy consumption (Energy Value = Hashrate × Energy Efficiency). The red-orange line on the upper chart marks energy-based fair value — ~$130K as of mid-2025. The blue oscillator below tracks how far current price deviates from that base.
Historically, when BTC trades far above its energy value, the oscillator enters the red zone (100%+ overvaluation). In early 2021, BTC at ~$60K was more than 100% above its energy value at the time. Conversely, during 2022, BTC traded below energy value — with the oscillator in the green (undervalued) zone.
Currently, the oscillator sits around zero, with BTC ($107K–110K) trading 10–20% below modeled fair value. This suggests BTC is not overheated. Should energy value reach ~$150K later in 2025, and price trade at a 50–100% premium (common near cycle peaks), that would imply a $225K–300K range.
In other words: Energy Value Oscillator confirms BTC has ample headroom. Until this oscillator pushes above +100%, the market is unlikely to be "extremely overvalued" by this standard.
3. Bitcoin Heater (Derivatives Overheating Indicator)

Bitcoin Heater aggregates derivatives sentiment (funding, basis, options skew) into a single index from 0 to 1. Readings near 1.0 = froth, aggressive long positioning, and elevated leverage. Readings around 0.0–0.3 = cooling or risk-off sentiment.
In prior cycles (notably 2021), BTC Heater often breached 0.8 before local corrections. But during strong bullish momentum (Q4 2020–Q1 2021), Heater remained elevated without triggering immediate reversals. As of mid-2025, BTC Heater stands at ~0.6–0.7 — warm, but not overheated.
This suggests we’re not yet in the euphoric end-stage of the cycle. The final run-up could see BTC Heater hit 0.8–1.0. Until then, the market still has upside. It’s reasonable to expect periodic Heater spikes >0.8 before the top, but the final peak likely aligns with sustained red-zone readings.
4. Macro Index Oscillator

This composite index uses 40+ fundamental, on-chain, and market metrics to assess BTC’s macro phase. Values above 0 = Expansion; values below 0 = Contraction or Recovery.
In prior bull cycles, the oscillator transitioned from negative to strongly positive territory — peaking near 2–3 during 2021. At the 2022 bottom, it fell below –1. As of now, the Macro Index reads around +0.7 — clearly in growth phase, but still well below euphoric extremes.
That means the cycle is likely mid-way through its expansion. We expect this oscillator to climb toward 2.0+ as the cycle matures into late 2025. Until we see a plateau or reversal in core network activity, BTC has room to run. There are no signs of exhaustion yet.
5. Volume Summer (Liquidity/Participation)

Volume Summer aggregates net buy-side volume across spot and derivatives markets. Readings above zero signal net inflows; below zero = net outflows or reduced activity.
In early 2021, the index surged into bright green territory — a sign of retail FOMO and euphoric participation. In 2022, it dropped deep into the red, confirming capital flight.
Today, Volume Summer reads moderately positive (~+75K units) — bullish, but far from mania. The implication is that capital is returning, but the peak liquidity phase likely lies ahead (Q4 2025?). If this metric spikes into dark green again, expect blow-off dynamics.
At current levels, liquidity is supportive — but nowhere near maxed. More fuel remains for further upside.
6. Open Interest / Market Cap Ratio
This ratio measures how much leverage is deployed relative to market cap. In 2021, the OI/Mcap ratio hovered around 2–3%. In 2023, it surged to ~4%, setting up the mid-2024 correction. After the wipeout, OI/Mcap reset to 2%, cleansing excess leverage.
As of mid-2025, the ratio is back at ~3.5%. This suggests leverage is building again. While supportive of short-term upside (more firepower for rallies), it also increases risk. If the ratio climbs to 4–5%+ by year-end, it could foreshadow a crowded, unstable market ripe for a liquidation cascade.
We believe the final leg of this cycle may be characterized by record leverage — with OI/Mcap making new highs as price peaks. For now, however, there’s still runway.
Conclusion: Where BTC Could Be by December 2025
Bringing all metrics together — MVRV, Energy Value, derivatives sentiment, macro index, volume trends, and leverage — we conclude that BTC is in the heart of its bull cycle, but not yet near terminal phase.
There are no extreme signals of overvaluation. Most indicators show strong growth but remain below levels historically seen at cycle tops.
As such, our base case is that BTC finishes 2025 somewhere between $210,000 and $230,000 — representing more than 2x from current levels. At those valuations, we’d expect to see:
MVRV Z-Score > 7
Energy Value Oscillator > +100%
Bitcoin Heater ~1.0
Volume Summer in euphoric territory
OI/Mcap at historical extremes
Only then will this market likely transition from expansion to distribution.
*Source: https://capriole.com/charts/